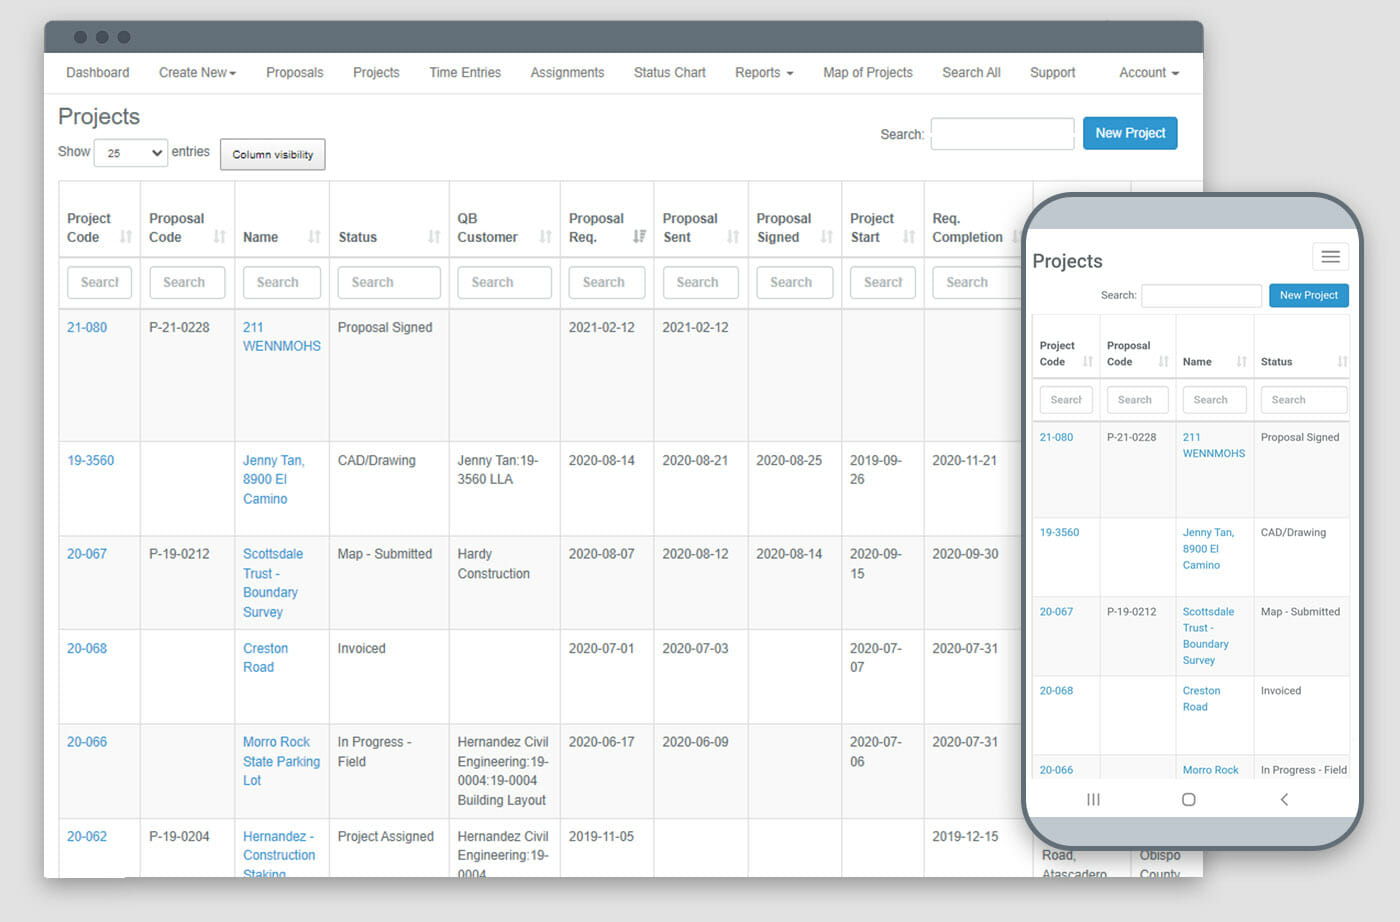
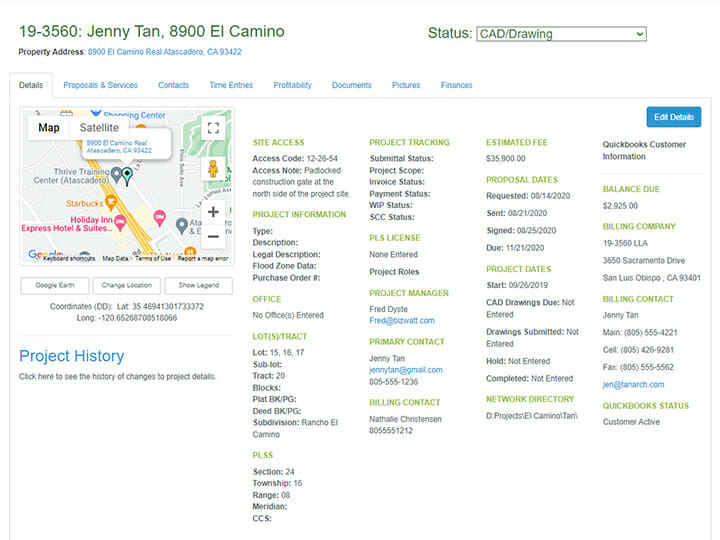
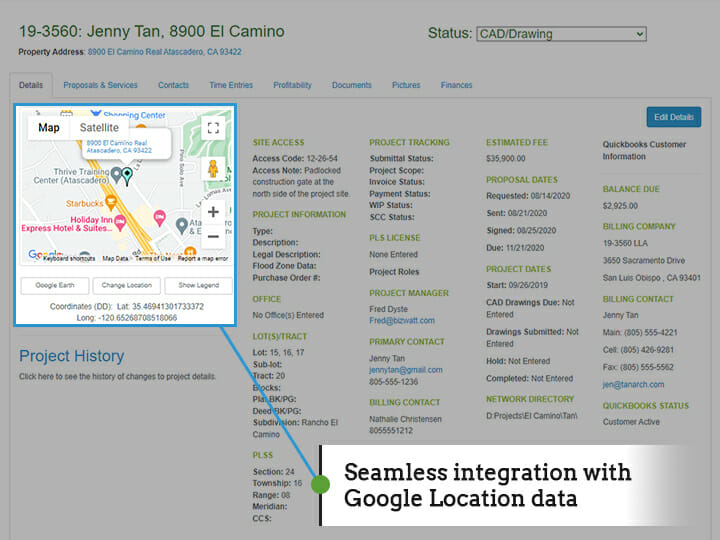
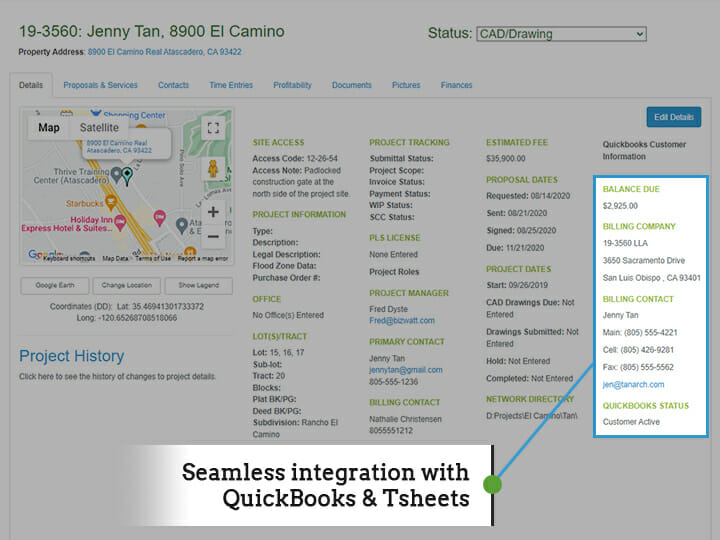
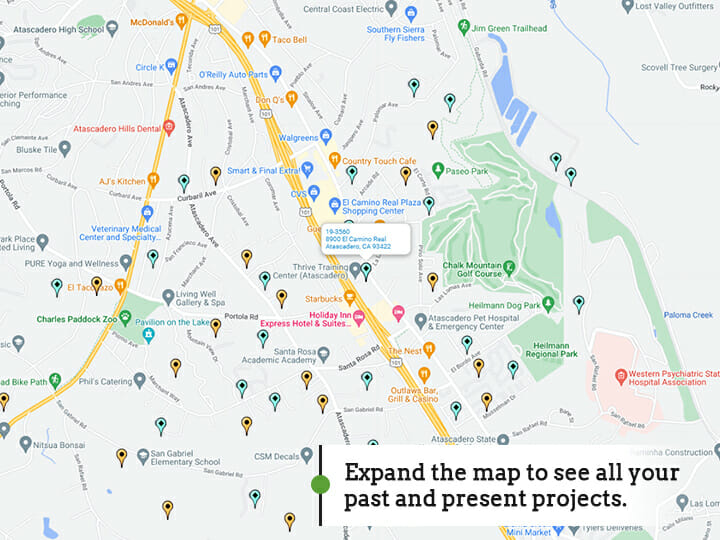
The Project Details tab display key information for each of your projects, including information pulled directly from Google Location and from QuickBooks. When you expand the Map, you can see all your other projects too, past and present. (Scroll through the image gallery above for visual examples.)
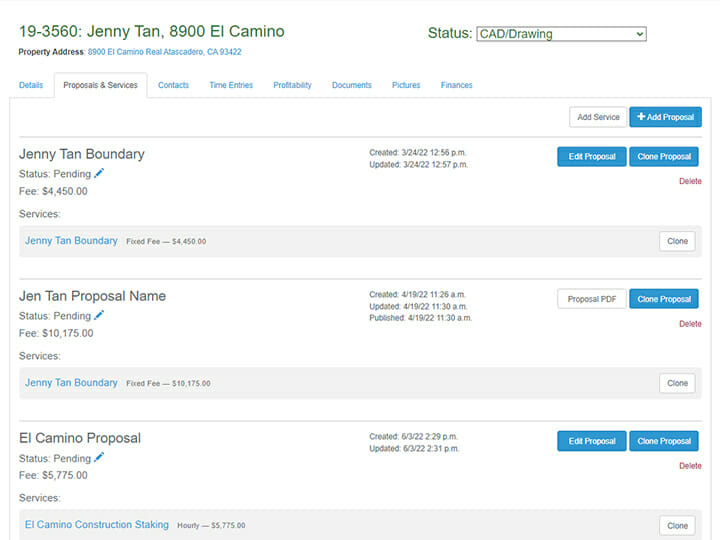
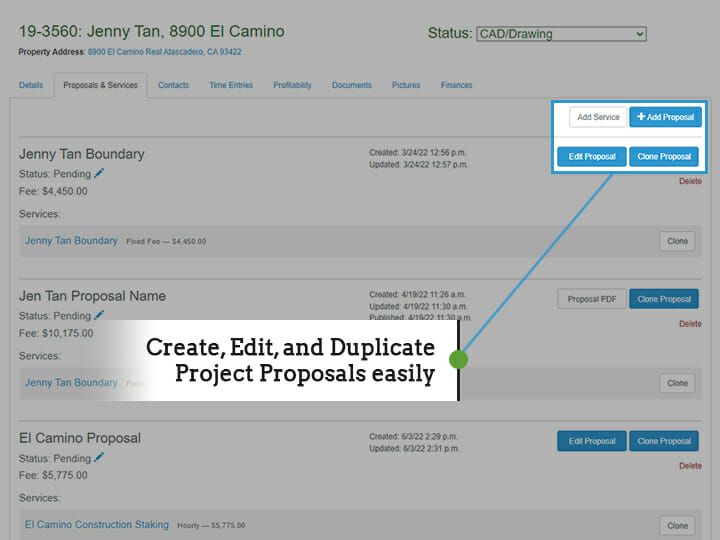
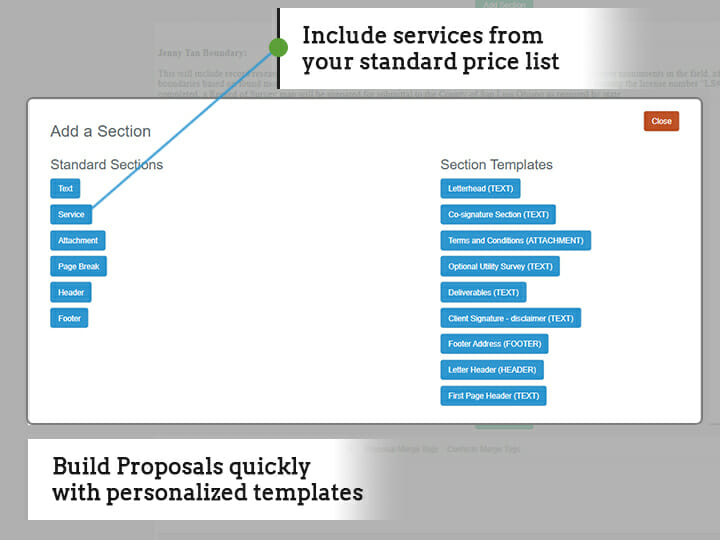
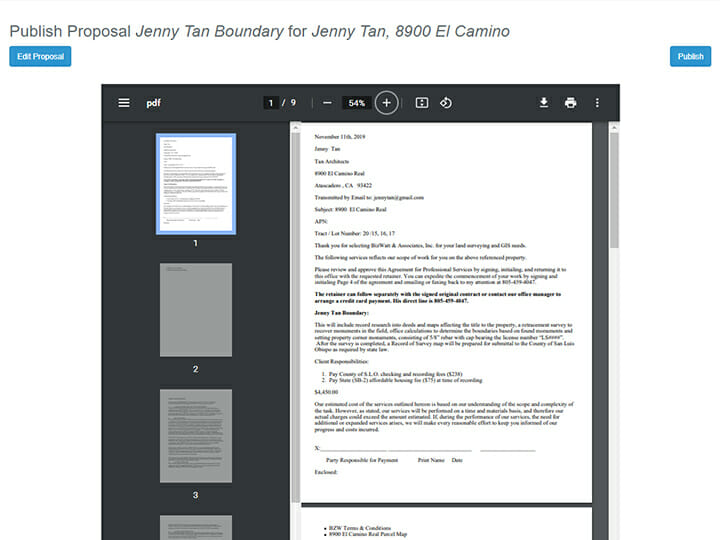
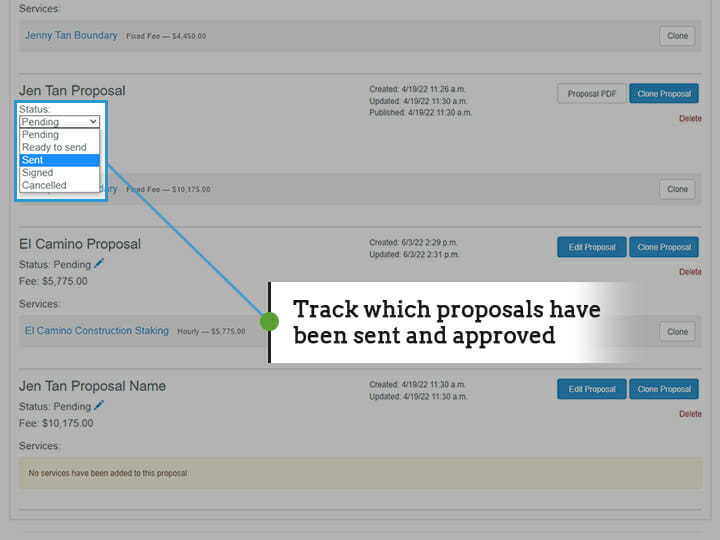
The Proposals & Services tab lets you quickly create and edit custom proposals from templates you create. Add on services, preview the final document, send it out, and then track its status—all from one place! (Scroll through the image gallery above for visual examples.)
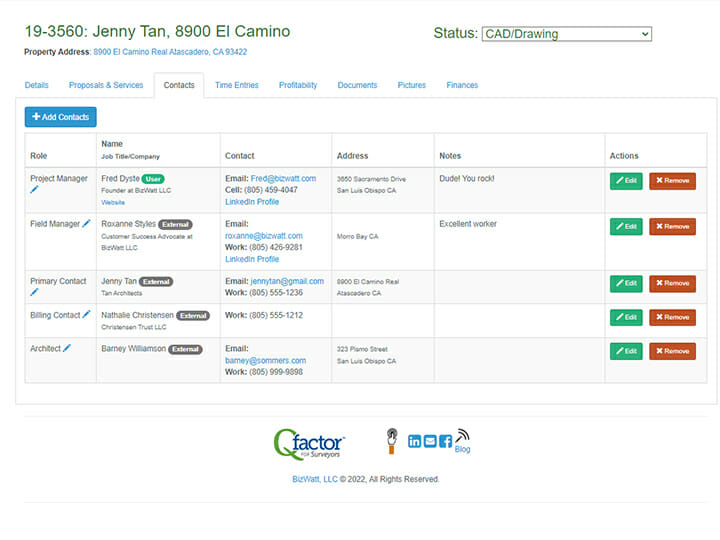
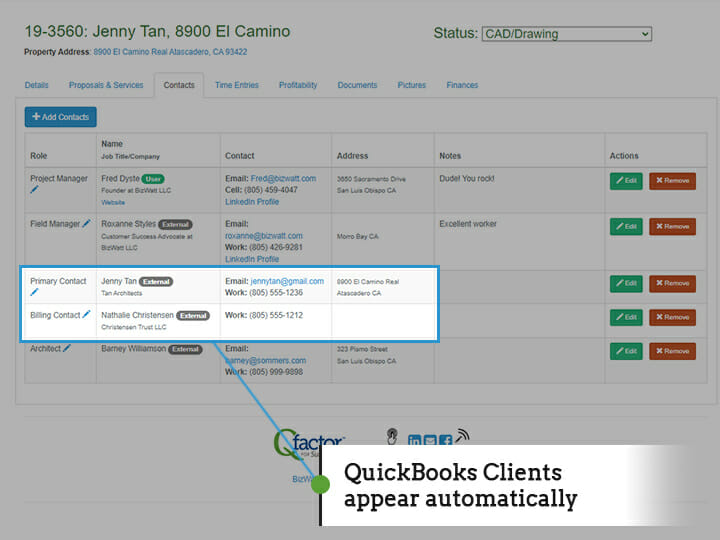
Maintain your list of team members and clients for each project. QuickBooks clients appear automatically, so data is only entered once. Anyone in your company can immediately see who’s on which project, reducing swirl! (Scroll through the image gallery above for visual examples.)
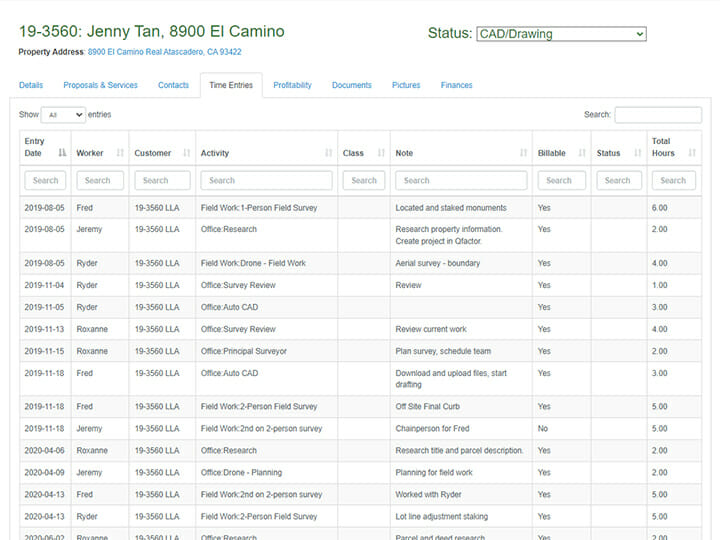
Team member hours entered in QuickBooks Time (or, as some may still call it, Tsheets) automatically appear in Qfactor. That means data only needs to be entered once, and it will appear wherever and whenever you need it.
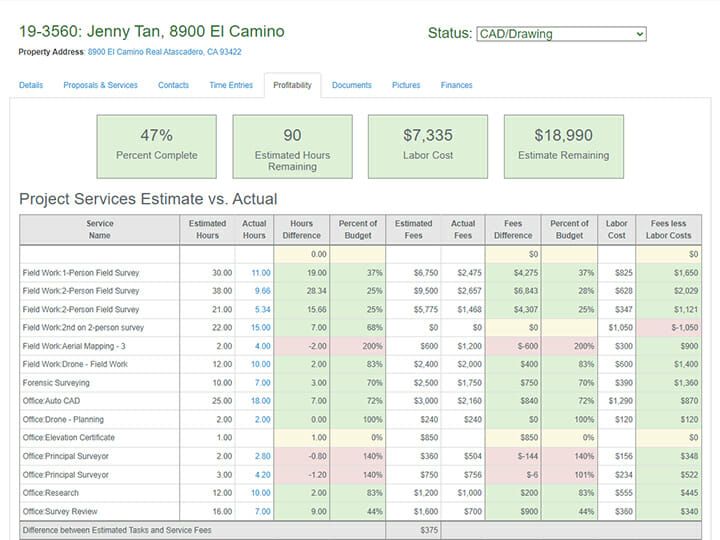
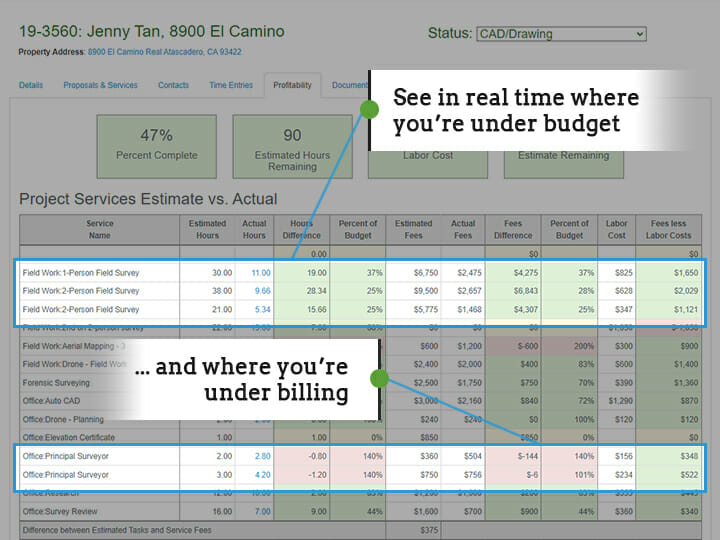
Project profitability is calculated in real time, so you can track it day by day. See whether you’re under budget, or over budget and under billing. Only the team members who need to see financial information have access. (Scroll through the image gallery above for visual examples.)
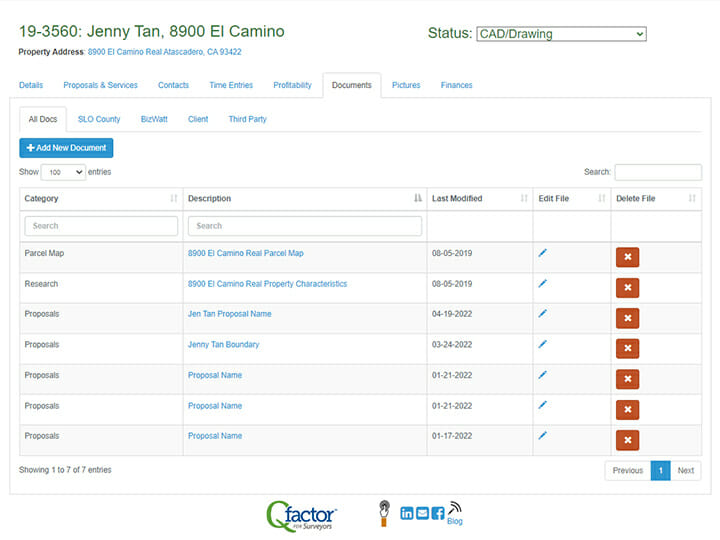
Stop wasting time hunting for documents on your server or computer. Qfactor functions like a virtual project binder: all of your project documents are at your fingertips anytime you need them.
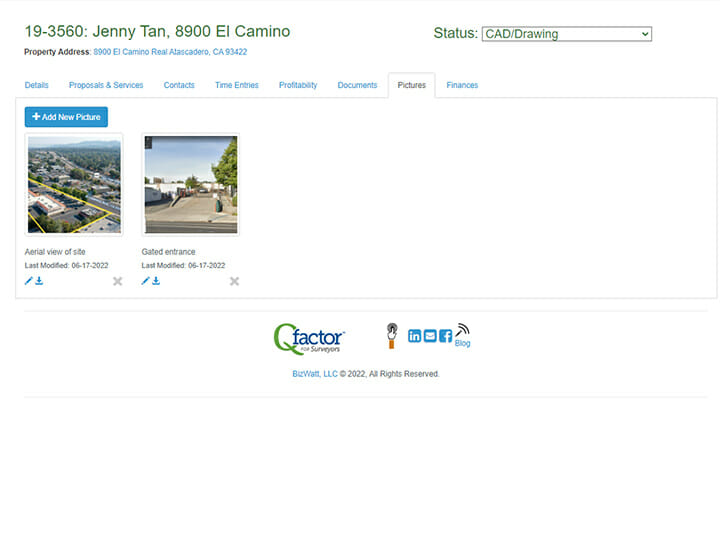
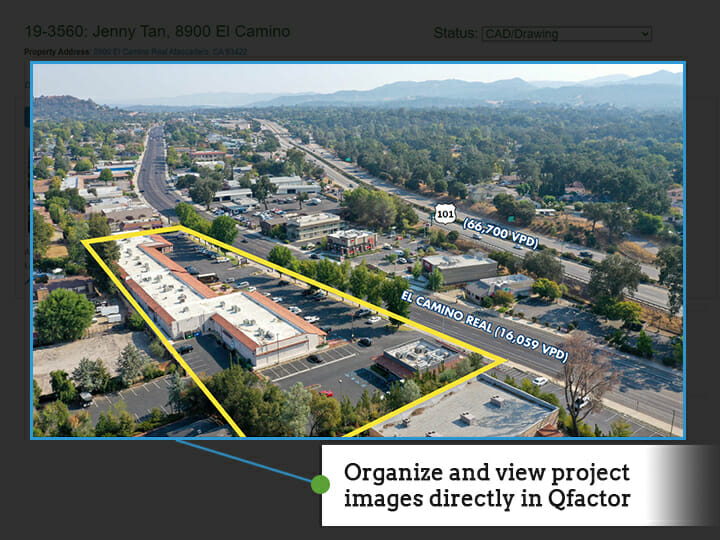
Qfactor helps you keep all of your images organizes as well, accessible in the office, or on a laptop or mobile phone out in the field. (Scroll through the image gallery above for visual examples.)
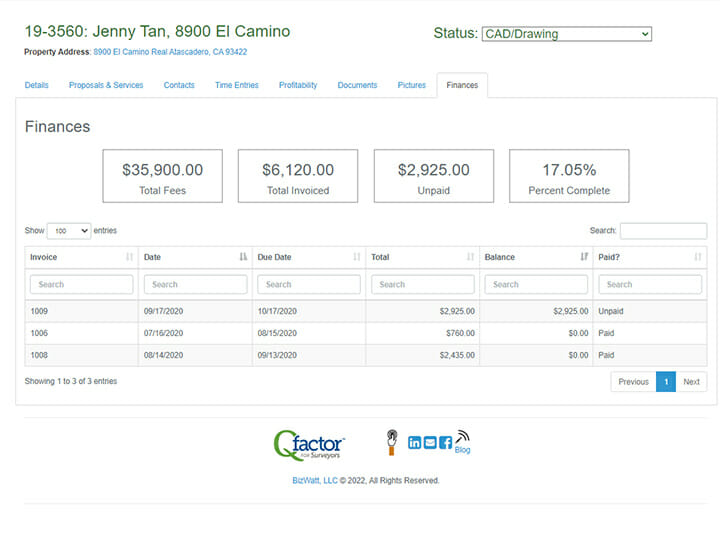
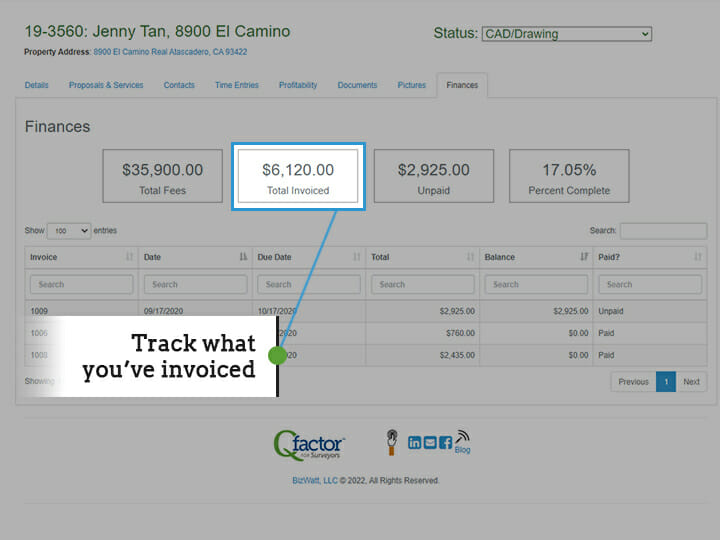
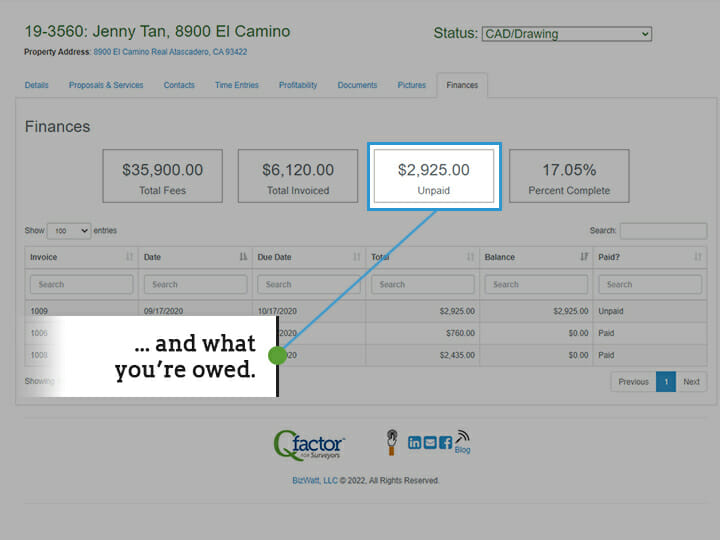
Qfactor’s seamless integration with QuickBooks automatically calculates completed work you can submit invoices for, and whether you’ve been paid. (Scroll through the image gallery above for visual examples.)
